Thursday, May 17, 2012
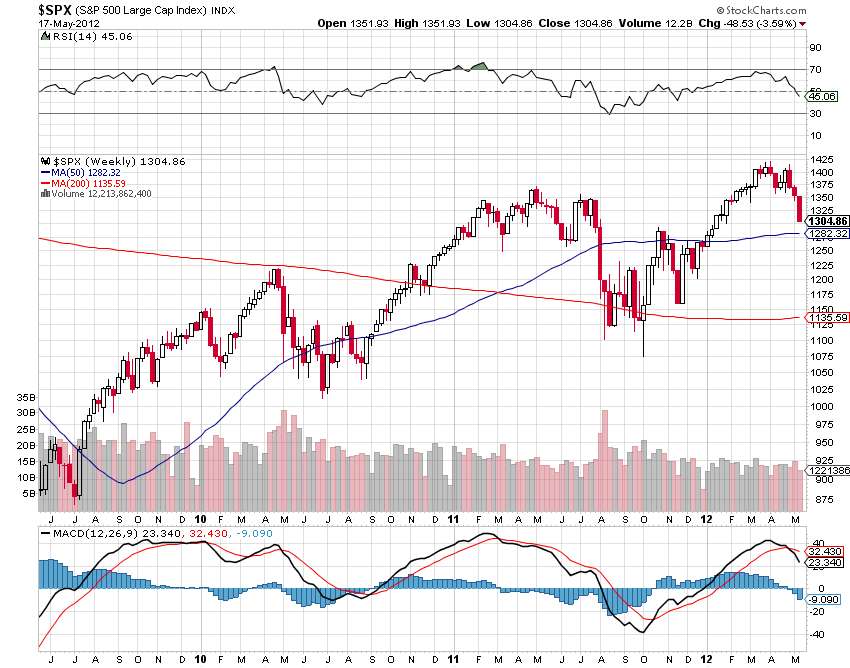
S&P 500 Weekly Figures
The S&P appears to be headed for a second week of negative MACD. Fast too approaches the 50 week moving average - roughly equivalent to the 200 day MA; both of the past two summers' corrections have broken through this level, with 2011's precipitating a near bear market drop before staging a come back from November forward.
Subscribe to:
Posts (Atom)